Take your shot
There have been 39 field goals scored after six rounds of the Hockey One League (M). This is a small sample size but it is sufficient to start generating insight into goal-shooting patterns in the competition. To do this, we have collected and plotted the approximate shot locations for all field goals scored by each team in the competition (see Figure 1).
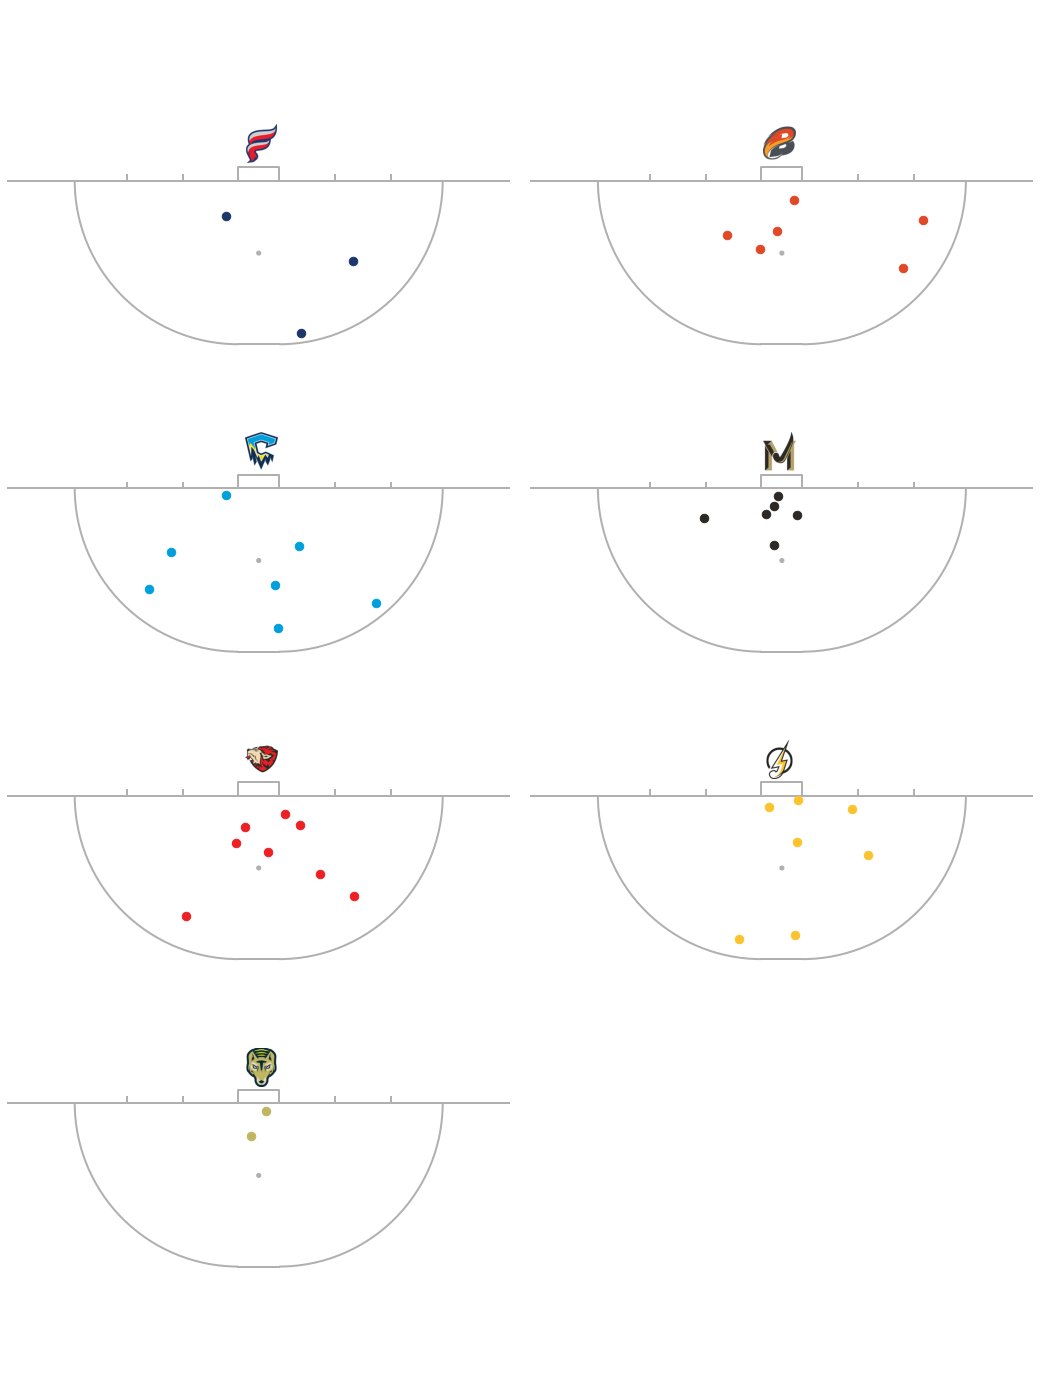
Figure 1: Approximate ball locations for shots that led to a field goal scored during rounds 1 to 6 of the Hockey One League (M).
Figure 1 shows that the Tassie Tigers have scored the fewest field goals of any Hockey One League team and Hockey Club Melbourne tends to score most of its goals in the “hot box”, a loosely defined area immediately in front of the goal.
The concept of the “hot box” can be illustrated by grouping the data across teams and using a kernel density plot (see Figure 2). The bright yellow area of the plot indicate the area where there is the highest density of ball locations for shots where a field goal was scored. The darker purple areas indicate areas where there is a low density of spots from where a field goal was scored. The interesting, asymmetric aspect of the figure suggests a tendency toward the right, or forehand, side for goal-scoring shots (though it does not necessarily mean that it was a forehand shot that scored the goal).
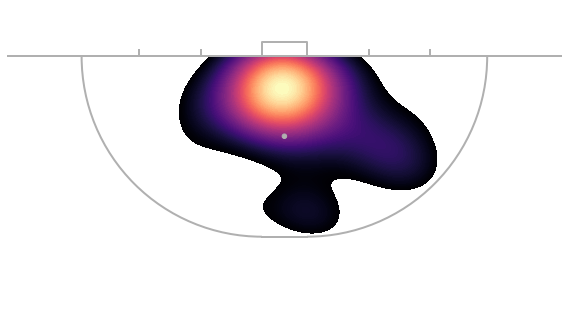
Figure 2: Kernel density plot of ball locations for shot where a field goal was scored.
The shot location data enables the calculation of two important factors in determining whether a shot is successful - the angle and the distance to the goal. For instance, Aran Zalewski (Perth Thundersticks) scored an eye-catching goal from near the top of the circle in Round 1. The angle for that shot on goal was 17 degrees and the distance from the ball location to the centre of the goal was 12.6 metres (see Figure 3).
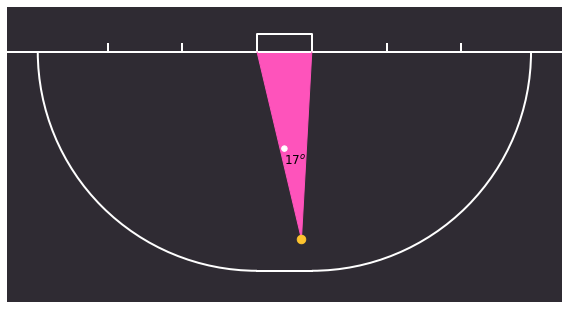
Figure 3: Angle and distance of Zalewski’s goal-scoring shot.
By comparison, the distance of Scott Boyde’s strike in Round 4 was less than Zalewski’s shot and his shooting angle (9 degrees) was much more acute (see Figure 4).
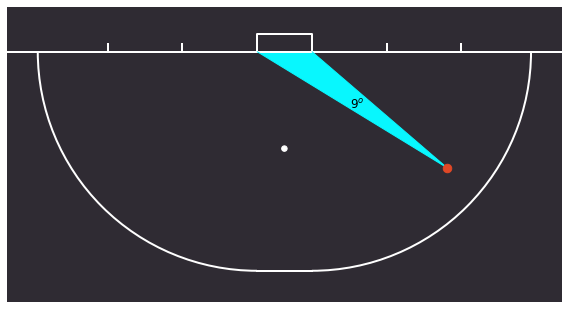
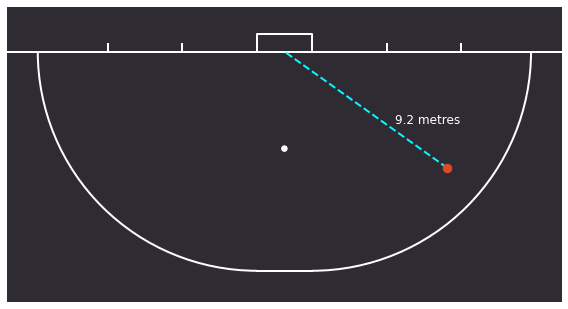
Figure 4: Angle and distance of Boyde’s goal-scoring shot.
The distribution of distances and angles for the first six rounds of the Hockey One League (M) is illustrated by the histograms in Figure 5. The shape of the distance histogram is interesting. It is consistent players either take a shot immediately upon entering the circle or endeavouring to get the ball to a player in the ‘hot box’. In the histogram of angles, scoring shots that are very close to the goal have a wide angle and explain some of the data on right of the chart. The large number of goal-scoring shots in first bin reflect two factors: (i) shots further away from the goal have a smaller angle; and (ii) players do take goal-scoring shots from wide angles close to goal.
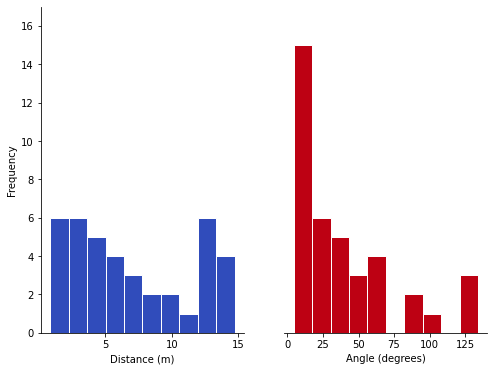
Figure 5: Histogram of the distance and angle of goal-scoring shots
One factor, which we have not measured, but which has shown to be relevant in assessing goal-scoring shots in football is the number of players between shot location and the goal. For instance, Joel Rintala took a goal-scoring shot with angle of 4 degrees against NSW Pride in Round 5 but it was in a situation where the NSW goalkeeper had been taken off the field and Rintala was shooting into an empty net.
We are looking to develop our goal-shooting analysis. At present, our collection of location data has focused on goal-scoring shots from general play. This has meant we have only focused on successful outcomes. To properly undertake the next stage of analysis, we will need to expand our location data to look at unsuccessful outcomes, that is saved and missed shots. This will enable the application of machine learning techniques to generate some further insight on goal shooting. We look forward to sharing this type of work with you in a future post.