Give me the ball!
Ever wondered how many touches an elite hockey player makes during a game? Round 2 of the Hockey One League provides some interesting insights into the high degree of variance in touches between players and teams. For instance, Brisbane Blaze defender, Tim Howard, amassed 70 touches in their game against the Canberra Chill while the competition’s leading goalscorer, Nathan Ephraums (HC Melbourne), had 18 touches.
Generally, defenders touched the ball more frequently than attackers. There were, however, distinctions between the midfield and defender roles across the teams during Round 2 (see Figure 1). For instance, the centre half (aka centre mid) accumulated the most touches for half the teams (i.e., HC Melbourne, Perth and Tassie) while full backs accumulated the most touches for the other teams (i.e., Brisbane, Canberra and Adelaide).


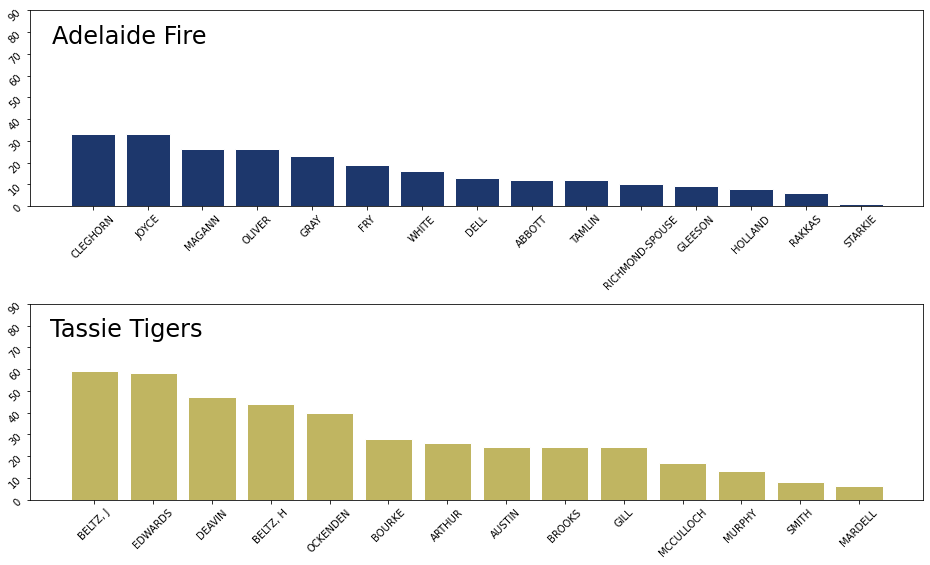
Figure 1: Touches by player during Round 2 of the Hockey One League (m). Touches includes passes, carrying the ball, crosses, clearances and shots. Goalkeeper saves are recorded but not included in the charts above. Note the x-axis is the same across all charts to promote comparison.
There are other differences too. Brisbane, in particular, was notable for the concentration in touches among their two fullbacks (Howard and Kenny), right half back (Weyer) and centre half (Whetton). By contrast, HC Melbourne had less dispersion in touches across their team. The critical roles played by Eddie Ockenden (Tassie Tigers) and Jake Harvie (Perth Thundersticks) also stand out due to the distinction from other players in similar positions.
Passing is the most common way to accumulate touches. Between 500 and 600 passes were made in each of the three matches from Round 2. A team’s share of passing activity can provide a useful, albeit, not perfect proxy to their share of possession. The data indicates the first two games of the round were relatively balanced in terms of possession, whereas Tassie Tigers enjoyed a lop-sided share of possession against Adelaide Fire (and yielded the most lop-sided result with the Tigers winning 5-0).

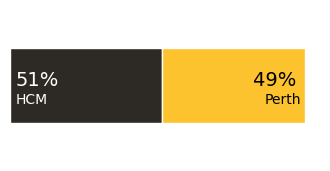

Figure 2: Possession share in each Round 2 match measured by share of passing activity.
The possession statistics do not shed much insight on Perth Thunderstick’s decisive 8-5 victory over HC Melbourne. Delving into the data reveals that some of Perth’s possession may not be captured by merely looking at passing activity. Perth players were inclined to carry and engage HC Melbourne defenders before using the ball. Jake Harvie and Aran Zalewski were particularly adept at carrying the ball forward without turning it over. Perth also gained a decisive difference through its attacking penalty corners. Perth dramatically improved the efficiency of its attacking penalty corners from Round 1 - it scored 4 goals from 5 PCs in Round 2 (compared to 2 goals from 13 PCs in Round 1).